Back to solution list
Business Intelligence for management control
Business Intelligence within the ERP provides managers with clear data and reports for day-to-day and strategic decision-making.
Make decisions based on accurate information
Evaluation of key indicators in the area of finance, trade, warehouse or purchasing.
Management reports for correct decision-making.
Clarity and intuitiveness of working with key information.
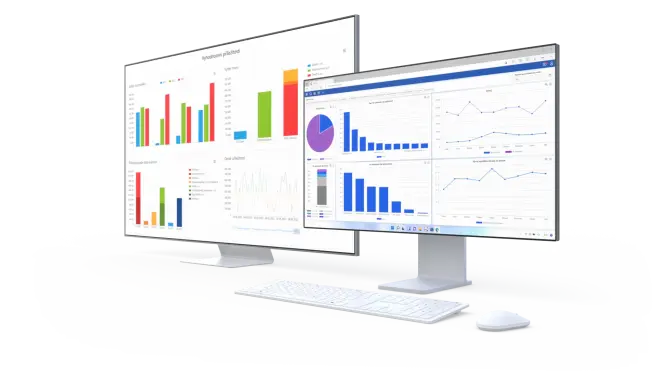
Interactive dashboards with an overall adn detailed overview.
Constantly up-to-date overview of events and developments in the company.
Always have an overview of the most important things
Use business intelligence tools to monitor the key performance indicators of the company, both in the short and long term. You can easily choose viewpoints, criteria or axes, and thus create analyses, which are illustrated using clear dashboards, graphs, tables and color indicators. BI solutions from K2 are among the best on the market.

Data are very valuable asset of any company. Those who can fully utilize their potential thanks to Business Intelligence gain a great competitive advantage.
Miloslav Peterka, senior BI Consultant
Complete overview of companies functioning
Business Intelligence tools collect and analyze data from various sources, thereby providing companies with a comprehensive overview of their operations. This enables managers to make informed, data-driven decisions that lead to better results. BI makes it possible to measure, evaluate and optimize key company processes, identify inefficiencies and optimize workflows. All this leads to substantial savings of time, money and resources, and overall to an increase in efficiency and productivity.
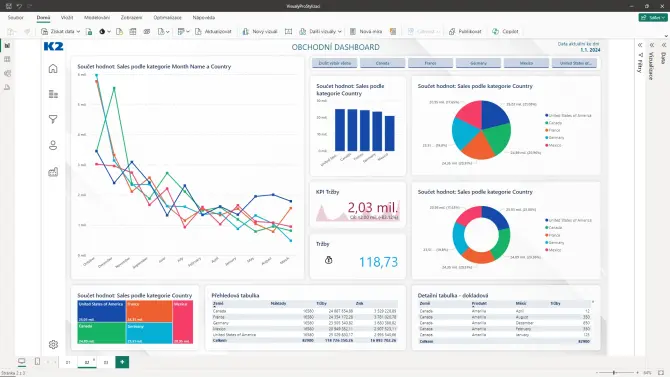
Intuitive dashboards for key managers
Follow what is happening in the company in a clear graphic form. Within one panel, you have the opportunity to observe all the key indicators of your business. In doing so, you can simply click through to each metric and find out all the other details about it.
Pivot tables
The basis of Business Intelligence is a user-friendly and intuitive semantic model. It is this that allows you to look for context in the huge amount of data that your company produces every day. It shows the connections between individual activities that are currently taking place in your company. Through pivot tables, you can evaluate everything by time, center, customer, product and a number of other dimensions. You can also easily create ad hoc reports of everything you need to present or start solving together with others.
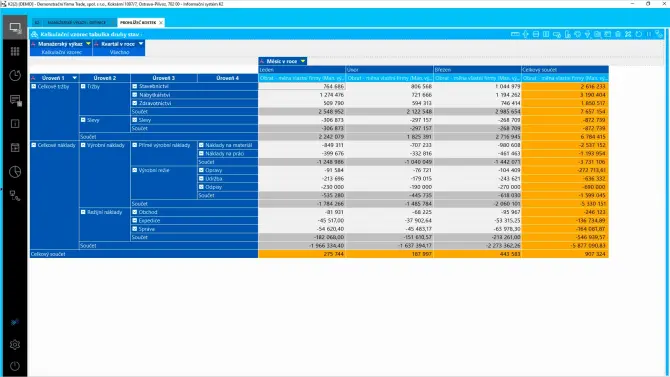

Management reports
Managers need to be in control of the management of the sections for which they are responsible. Individual costs and revenues need to be tracked in understandable and manageable categories, including their development over time in relation to the established plan. This is exactly what management reports are for – top reports for evaluating economic results.
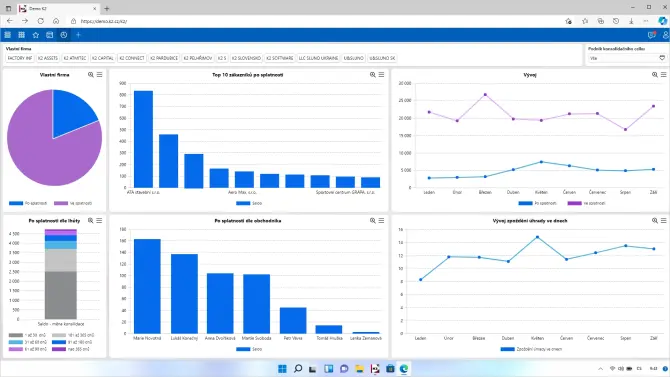
BI in finance and accounting
Do you need to know who owes you, to whom you owe, how long individual invoices are past due, how the development of payment behavior looks like? Or are you interested in costs and revenues, asset value, depreciation, or anything your accounting or finance department deals with? With a few clicks you can have this information, quickly and accurately in perfect graphs and reports that you create and filter exactly according to your requirements. BI systems provide company management with a comprehensive overview of the financial situation and performance, thereby supporting informed decision-making and strategic planning. Improving cash flow and optimizing payment processes go hand in hand with clear reports.


BI in purchasing and sales
BI allows you to collect and analyze data on buying and selling activities, such as prices, volumes, margins, and track them, for example, across individual customers or suppliers. This allows businesses to identify trends, patterns and anomalies that might otherwise remain hidden. These insights are then used to optimize purchasing strategies, negotiate with suppliers, streamline sales and improve marketing campaigns. Reduce costs, increase profits and strengthen your competitiveness with K2 BI.
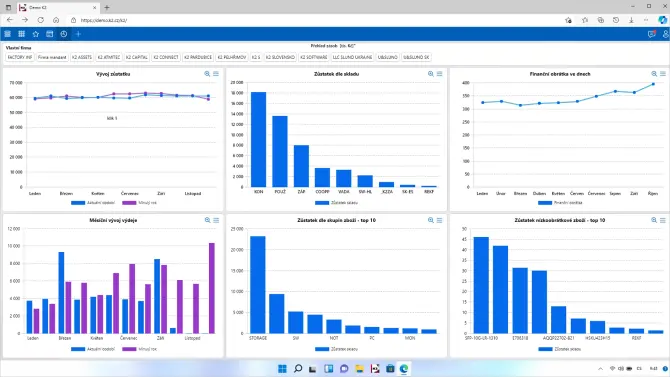
BI in production and warehouse
K2 BI brings a whole range of advantages that lead to the optimization of warehouse stocks, streamlining of logistics and overall strengthening of competitiveness. The key ones include perfect inventory control down to the level of individual batches, both in quantitative and financial terms. It allows you to monitor and analyze the movement of material and its turnover rate. Uncovering low turnover goods and the volume of unnecessarily tied up capital is a piece of cake thanks to BI.

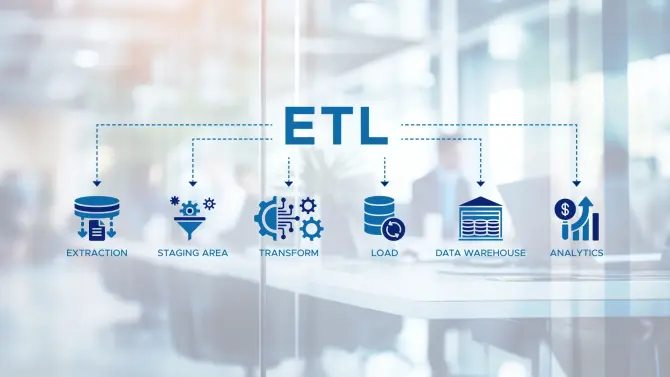
ETL Framework
ETL is an abbreviation for Extract, Transform and Load, i.e. processes ensuring data transfers and transformations needed for their evaluation. K2 BI uses its own ETL framework, which facilitates and automates the data integration process. It helps data analysts work more efficiently with data from various sources, transform it into the required format and load it into the target system, which is a data warehouse and semantic model. Our ETL framework works fully incrementally and processes in parallel only those data that have changed since the last filling. This significantly shortens the time for updating information, which can also take place in individual areas independently of each other, even at the request of the user.
Power BI
Power BI is a comprehensive data visualization platform. It enables businesses and individuals to easily collect, transform, analyze and visualize data from a variety of sources, be it internal databases, cloud services, Excel files or websites. It offers an intuitive interface for creating reports, their presentation, advanced analytical functions and sharing and collaboration options. For K2 BI, Power BI is one of the possible ways to visualize information, as it is exposed on the same in-memory technology.
Why use BI from K2?
- You get clear dashboards for managerial decision-making
- You will create pivot tables on top of the semantic model
- It will help you visualize data in Power BI and K2 dashboards
- You get an advanced ETL framework
- Our experienced BI team makes adjustments according to the specific needs of the customer
Examples of use
Optimization of warehouse stocks
BI helps companies track and optimize inventory. It analyzes historical inventory movement data, uncovers seasonal trends, and identifies low-turnover items. This enables companies to effectively manage inventory and minimize storage costs.
Optimizing the product portfolio
If you sell your own products, thanks to BI you know the structure of the costs spent on them and also the profit realized when selling them. You can easily set the pricing policy correctly or focus on products with higher profitability.
Customer payment morale
Thanks to BI, you have detailed information about the payment morale of individual customers, including its development over time. In this way, you can quickly react to negative trends and thus prevent, for example, problems with the customer's impending insolvency.